

Marketing videos that drive views and engagement look like one problem to solve. Search this exact question and the guide that ranks for it treats it that way: shoot good footage, hook people fast, post everywhere, track your metrics.
None of that is wrong. It’s just built for a platform with its own audience and its own analytics. A WordPress site has neither, so half the checklist doesn’t transfer, and the other half never says what to actually measure.
The real problem isn’t the checklist. It’s that “views and engagement” collapses five separate skills into one: picking the right video for the moment, earning the click, earning the finish, reusing what’s filmed, and reading the right numbers. Skip one and the rest doesn’t matter.
This guide covers each in order, plus what to measure once the video is live. If you haven’t planned what these videos are for yet, Video Marketing Strategy: 7 Steps to Build One on Your WordPress Site covers that first.
TL;DR
- Views and engagement are five skills, not one: type, source, click, finish, reuse, plus reading the right metrics
- Match video type to funnel stage first; skipping this wastes every other fix that follows
- The click depends on the poster frame, title overlay, and placement; the finish depends on pacing against real watch-time data
- Wistia’s 2026 data shows engagement drops sharply past 5 minutes, and again past 30
- FluentPlayer’s retention curve shows which of the five skills is actually failing
- “Engagement” on your own site isn’t likes and shares; it’s watch time, retention, and completion
What the Retention Curve Can and Cannot Tell You
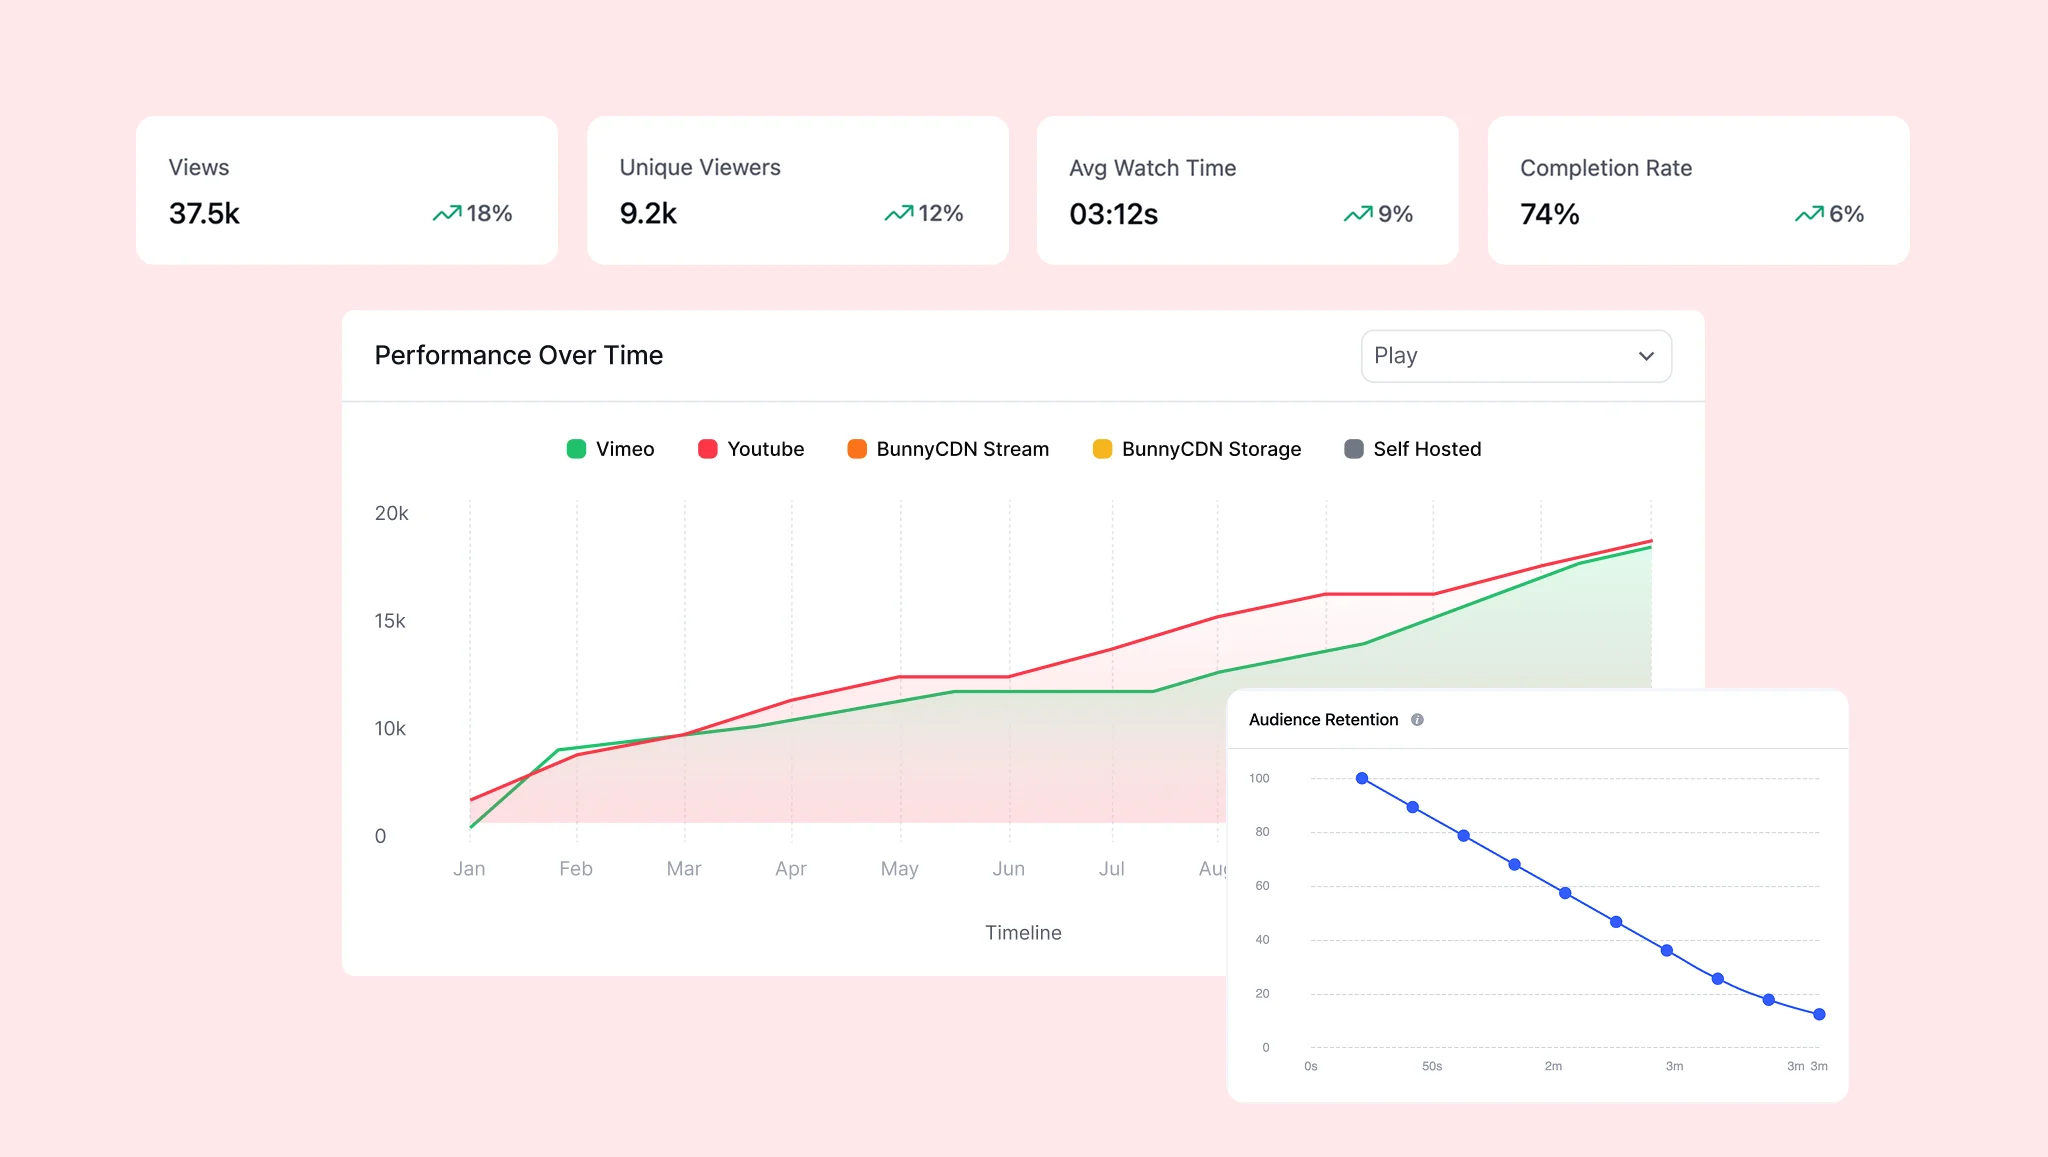
FluentPlayer‘s retention curve tells you the point in a video where viewers, in aggregate, stop watching. It does not tell you why. A drop at ten seconds is consistent with a poster frame that oversold what the video actually delivers.
It’s also consistent with autoplay grabbing a visitor who never chose to watch, or the wrong page pulling in the wrong audience for that video’s funnel stage. The curve narrows the list of likely causes. It doesn’t name one for you.
Do not treat one video’s curve as proof your whole library has a click problem or a finish problem. One video is one data point. Check the pattern across several videos with a meaningful play count before you generalize about the whole channel.
The Complete Workflow, Before Any Settings
- Match the video type to the funnel stage it’s for.
- Choose how to source the footage.
- Set the click-craft: poster frame, title overlay, placement, load speed.
- Set the finish-craft: pacing, chapters, where the ask sits.
- Structure the video for reuse.
- Read the retention curve and the other watch-based metrics.
- Recheck after a new sample of plays before changing anything else.
What You Need Before You Build
- FluentPlayer installed. Free tier covers video type placement, the click-craft settings, and Video Chapters.
- FluentPlayer Pro active. The retention curve, Interactive Layers, and Video Playlist are Pro-tier. The free plan has no curve to read.
- A video with enough plays to trust the shape. Under roughly 20 to 30 plays, the curve is noise, not signal. This is the step that fails silently: reading a thin curve and drawing a conclusion from it anyway.
- The video is already embedded and live on the page you’re diagnosing, not sitting in draft.
- The funnel stage is decided before you shoot, not after. This is what Step 1 depends on.
Step-by-Step: Build the Full Setup
Step 1: Match the type to the stage
This is the gate step. Skip it and no amount of click or finish craft saves the video, a testimonial placed on the homepage is talking to someone who hasn’t decided they have a problem yet, no matter how well the video itself is made.
Testimonials and reviews
Bottom-funnel, for someone close to a decision. Wistia’s 2026 State of Video Report found contact pages get a 51% engagement rate and thank-you pages hit 55%, both places a viewer is already close to committing, not still comparing options.
Product demos and walkthroughs
Consideration-stage content, for someone actively comparing options before deciding. These run long enough that pacing matters far more than it does for a short testimonial, which is why they lean heavily on the finish-craft work in Step 4.
Brand and behind-the-scenes video
Awareness-stage, built for recognition rather than a direct ask. Wistia’s data puts the homepage at the highest play rate of any placement tested, the natural spot for this type, since it’s the page most visitors reach before they know what they’re looking for.
Step 2: Source the footage
The source matters less than what happens after it’s on the page. A phone-shot testimonial, a screen-recorded demo, or a webinar clip all end up inside the same player. FluentPlayer connects to self-hosted video, YouTube, Vimeo, and audio on the free plan, with BunnyCDN, Mux, Gumlet, and Cloudflare available on Pro.
Compare the best video hosting options in WordPress→
Step 3: Fix the click
Three things decide the click: the thumbnail, the title overlay, and placement. A default thumbnail is often a frozen, mid-blink frame the player grabbed at random. FluentPlayer’s Custom Thumbnail Image lets you set a frame that tells the reader what they’re about to watch.
FluentPlayer’s Title Overlay names what the reader gets, not what the video is about. Do not use autoplay as a substitute for a real poster frame. Autoplay can inflate play counts with visitors who never chose to watch, masking a genuine click problem.
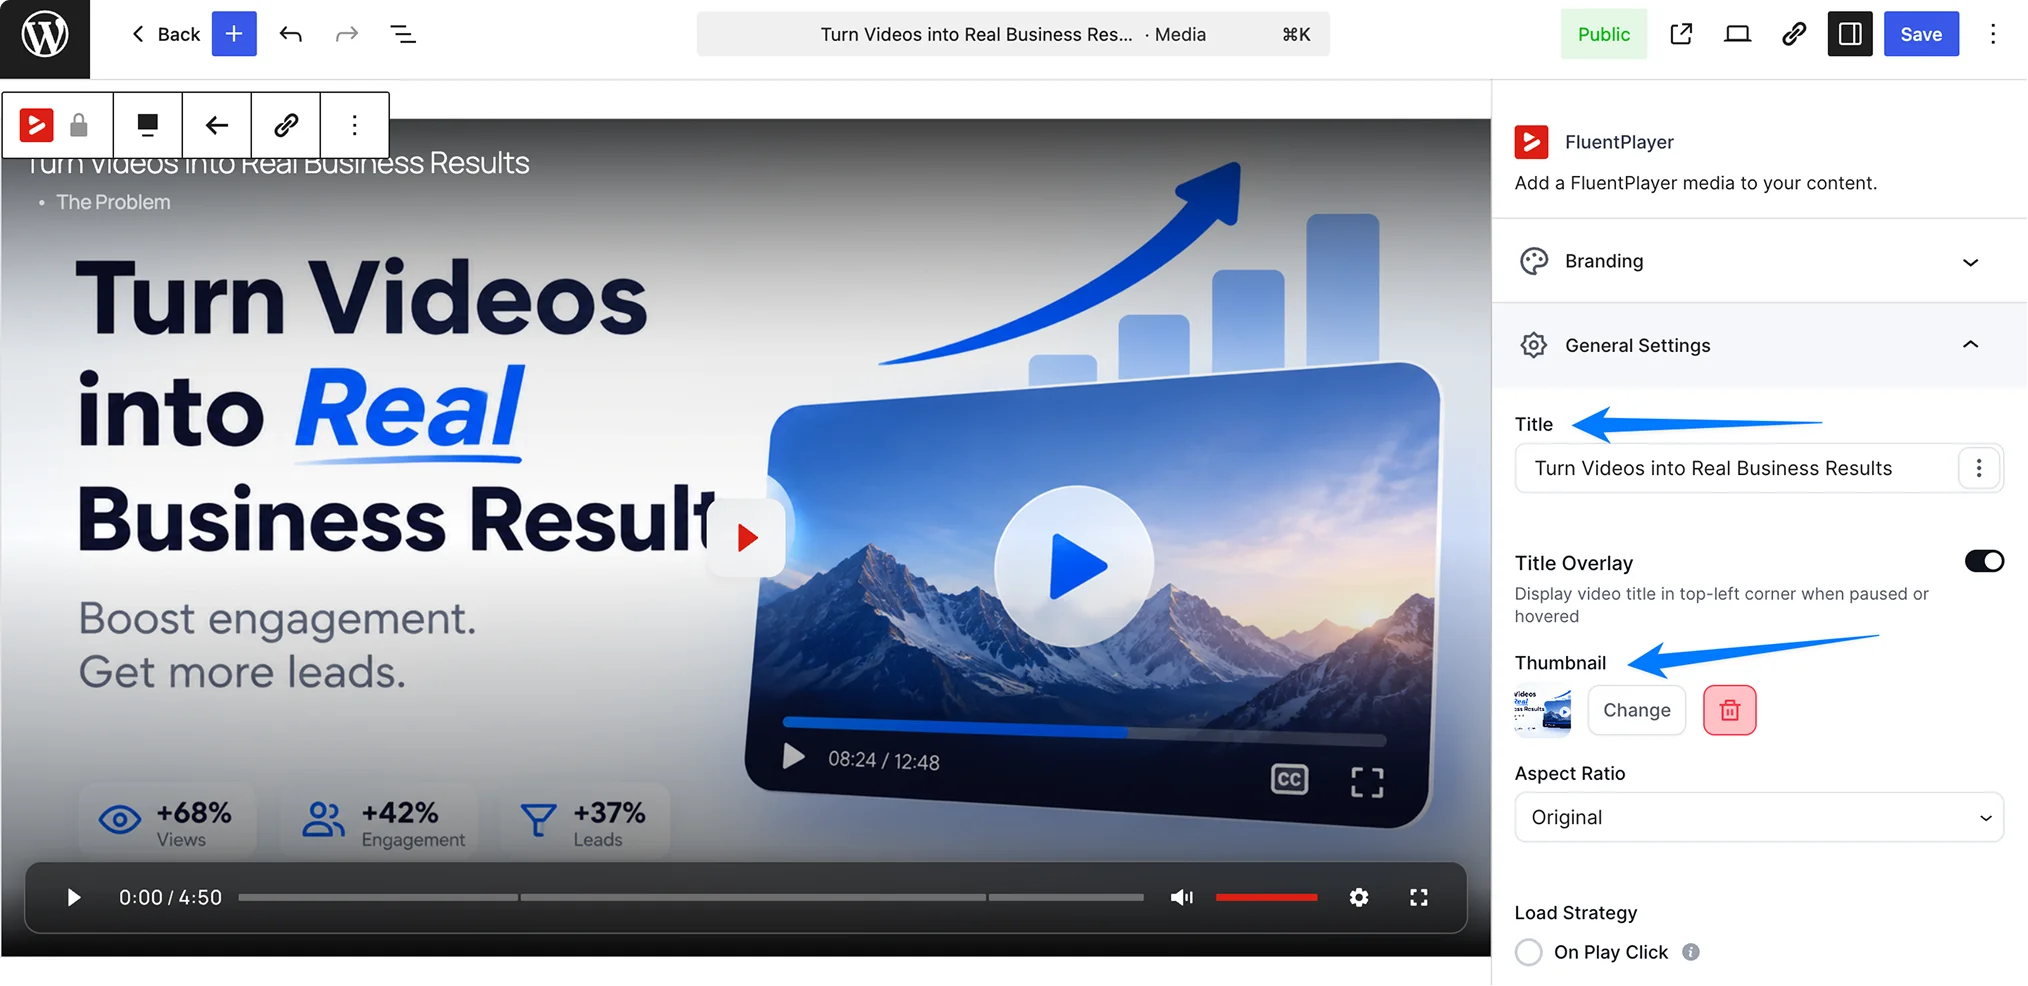
Thumbnail, title overlay, placement, and load strategy are all on FluentPlayer’s free plan already. Install FluentPlayer free and set these four before touching anything else on the page. This is the free-tier work; nothing here needs Pro to get started.
Step 4: Fix the finish
Pacing is decided against how long people actually watch, not how long you’d like to talk. Wistia’s 2026 data shows engagement holds fairly flat between one and five minutes, then drops sharply, with another 11% drop once a video passes 30 minutes.
Format changes the picture: instructional videos hit 74% engagement at three to five minutes, against a 43% average for all videos that length. A walkthrough earns more patience than a pitch, which is why the two formats need different pacing rules.
FluentPlayer’s Video Chapters, free tier, break a longer video into named sections so a viewer can skip straight to the part they need. FluentPlayer’s Interactive Layers, Pro tier, let you place a CTA at the point your own curve shows people are still watching.
Do not place a CTA layer at a timestamp copied from a different video’s curve. Place it against your own data instead, since two videos rarely lose viewers at exactly the same point, even within the same product category or niche.
Step 5: Structure for reuse
A single demo doesn’t have to answer only one question. Chapters, already set in Step 4, let each section act as its own entry point: pricing, setup, integrations- instead of forcing a viewer through the whole video to find one part.
Do not film a separate video for every topic a chapter could cover instead. The reuse only pays off if you resist rebuilding what chapters already handle. For a library of related videos, FluentPlayer’s Video Playlist (Pro tier) groups them into one interface instead of separate embeds competing for attention.
The Signal Model
| Curve shape | What it tells you | What it does not tell you | What to check |
| Steep drop in the first few seconds | Viewers are leaving before the content starts | Why they left. Could be the poster, the audio, or the wrong audience finding the page | Step 3, the click craft |
| Steady decline across the whole timeline | The opening held; the middle didn’t earn the time it asked for | Which specific minute is the actual problem, chapters can isolate it | Step 4, the finish craft |
| Flat line, very few plays at all | The video isn’t being tested yet | Whether the video itself is any good, it hasn’t had a fair chance | Step 3, specifically placement |
| Healthy click and finish, but no downstream conversions | The craft is working; something else isn’t | Whether that’s a funnel-stage mismatch or an offer problem | Step 1, whether the type fits where it’s placed |
What to Change Next
Change one thing at a time. If the curve points to Step 3, adjust the poster or the placement, not both, and not the pacing in the same week. If it points to Step 1, move the video or swap the type before touching the craft at all.
Mixing fixes in the same week is why the next check won’t tell you which change actually worked. Wait for one variable to settle before touching another, or the whole diagnosis has to start over again from Step 1, which wastes even more time.
Test the Diagnosis Before You Trust It
Case A: High play rate, low average watch time
Expect a steep early drop on the curve. Apply the Step 3 click fixes only, and leave pacing untouched. Recheck after new plays accumulate, expecting play rate to hold steady while watch time rises.
Case B: Low play rate, high watch time among the few who click
Expect a flat, thin curve with long sessions where data exists. Apply the placement piece of Step 3 and leave pacing untouched. Recheck, expecting play rate to rise while watch time per session holds.
Case C: Moderate plays, gradual mid-video decline, no sharp cliff
Apply the Step 4 finish fixes only, and leave the poster and title alone. Recheck, expecting the decline to flatten past the point where a chapter or the ask moved.
Case D: Solid click and finish numbers, but the video isn’t producing leads or sales
Revisit Step 1 before touching the craft again. A demo performing well in the wrong funnel stage still won’t convert, no matter how strong the numbers look.
Edge cases to check before diagnosing anything:
- Fewer than roughly 20 to 30 plays: the curve is noise. Wait for more data.
- The video embedded on more than one page: the aggregate curve blends placements and can hide a placement-specific problem.
- Autoplay enabled: play count includes visits that never chose to watch.
- The video re-uploaded at the same embed: old retention data can carry over and misrepresent the new cut.
Measure Whether It Worked
- Play rate = plays ÷ page visits where the video appears
- Engagement rate = average watch time ÷ total video length
- Completion rate = viewers who reached the final quartile ÷ total plays
A first check after a small number of new plays tells you whether something obviously changed, not whether the fix is proven. Wait for a sample comparable to the original curve before concluding anything, and change only one variable between checks so you know what actually moved the number.
Read the Curve Before You Change Anything Else
View counts tell you almost nothing on their own. Watch time, retention, and completion tell you whether the video worked, and which of the five skills above still needs work before you touch anything else on the page or in the settings.
The free tier gives you the type, click, and reuse controls already covered above. It doesn’t give you the curve that tells you whether you actually need them. See FluentPlayer’s retention analytics to read the shape for your own videos.
Frequently Asked Questions
What’s a good video engagement rate?
Wistia’s 2026 data puts videos under one minute at roughly 52% average engagement. Longer videos show a lower percentage but rack up more total watch time, so compare videos of similar length rather than your whole library at once.
What type of marketing video should I make first?
Match it to the funnel stage: a testimonial if a decision is close, a demo if people are comparing options, a brand story if you’re building awareness first. Getting this match wrong is the most common reason a good video underperforms.
Why does my video have views but no engagement?
This usually points to a finish problem: the poster and title did their job, but something in the first minute, often pacing, is losing people before the payoff. The retention curve confirms it rather than leaving you to guess.
Can one video cover more than one topic?
Yes, with Video Chapters. Breaking a longer video into named sections lets a viewer jump to the part they need instead of leaving to search for a shorter video elsewhere, and it works on both free and Pro plans already.
Can FluentPlayer show me where viewers drop off?
FluentPlayer’s Pro-tier analytics dashboard plots a retention curve for each video, alongside play rate, watch time, and completion rate, all inside WordPress without needing a separate platform login or dashboard, so the same numbers live in one place.